The Recurio Dashboard is your command center for tracking subscriptions, revenue, and customer health at a glance.
It provides real-time metrics, visual reports, and insights to help you understand how your subscription business is performing.
Accessing the Dashboard
Navigate to: Recurio → Dashboard
Once Recurio is activated, you’ll find the Dashboard in the WordPress admin sidebar.
It opens by default after installation or when you click the Recurio menu item.
Dashboard Layout Overview
The Dashboard is divided into three main sections:
- Key Metrics (Top Summary Cards)
- Charts & Visual Reports
- Subscription & Customer Insights
Each area gives you a different layer of understanding — from overall performance to specific trends.
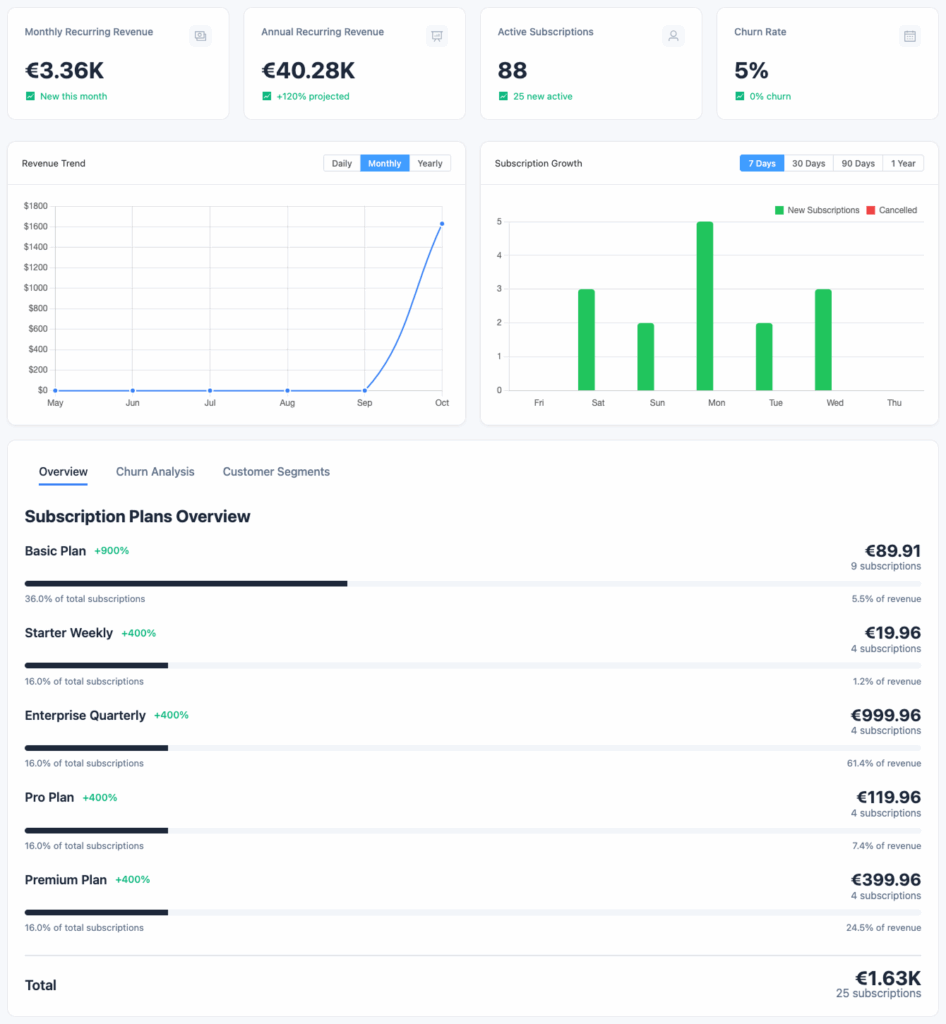
Key Performance Indicators (KPIs)
At the top, you’ll see your most important business metrics.
Each metric updates automatically in real time as subscription data changes.
| Metric | Description | Why It Matters |
|---|---|---|
| Total Subscriptions | Total number of subscriptions ever created. | Helps you track overall volume and growth. |
| Active Subscriptions | Subscriptions currently billing or in trial. | Indicates ongoing recurring revenue sources. |
| Monthly Recurring Revenue (MRR) | Normalized monthly subscription revenue. | Shows predictable monthly income. |
| Annual Recurring Revenue (ARR) | MRR × 12. | Long-term revenue projection for planning. |
| Average Revenue Per User (ARPU) | MRR ÷ number of active customers. | Measures pricing efficiency and profitability. |
| Customer Lifetime Value (LTV) | Average revenue per customer across their lifetime. | Useful for forecasting acquisition ROI. |
| Churn Rate | % of customers who canceled in a given period. | Reveals customer retention performance. |
| Growth Rate | Month-over-month change in total active subscriptions. | Shows business momentum. |
💡 Tip: A churn rate under 5% is considered healthy for most subscription businesses.
Charts & Visual Reports
Revenue Trend Chart
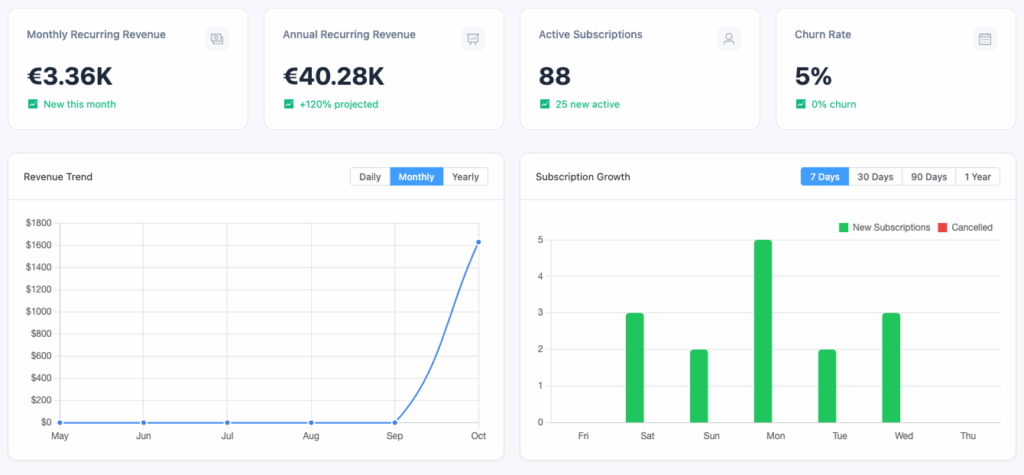
Visualizes: Monthly or daily recurring revenue
What You’ll See:
- Line graph of total revenue over time
- Toggle between MRR and ARR views
- Hover to view exact values by date
Use Case:
Spot growth patterns, identify slow months, and measure the impact of new plans or marketing campaigns.
Subscription Growth Chart
Visualizes: New vs. canceled subscriptions over time
Insights Provided:
- New subscriptions per day/week/month
- Cancellations within the same period
- Net growth (difference between the two)
📌 Use this chart to identify spikes in cancellations or successful acquisition campaigns.
Churn Analysis Chart
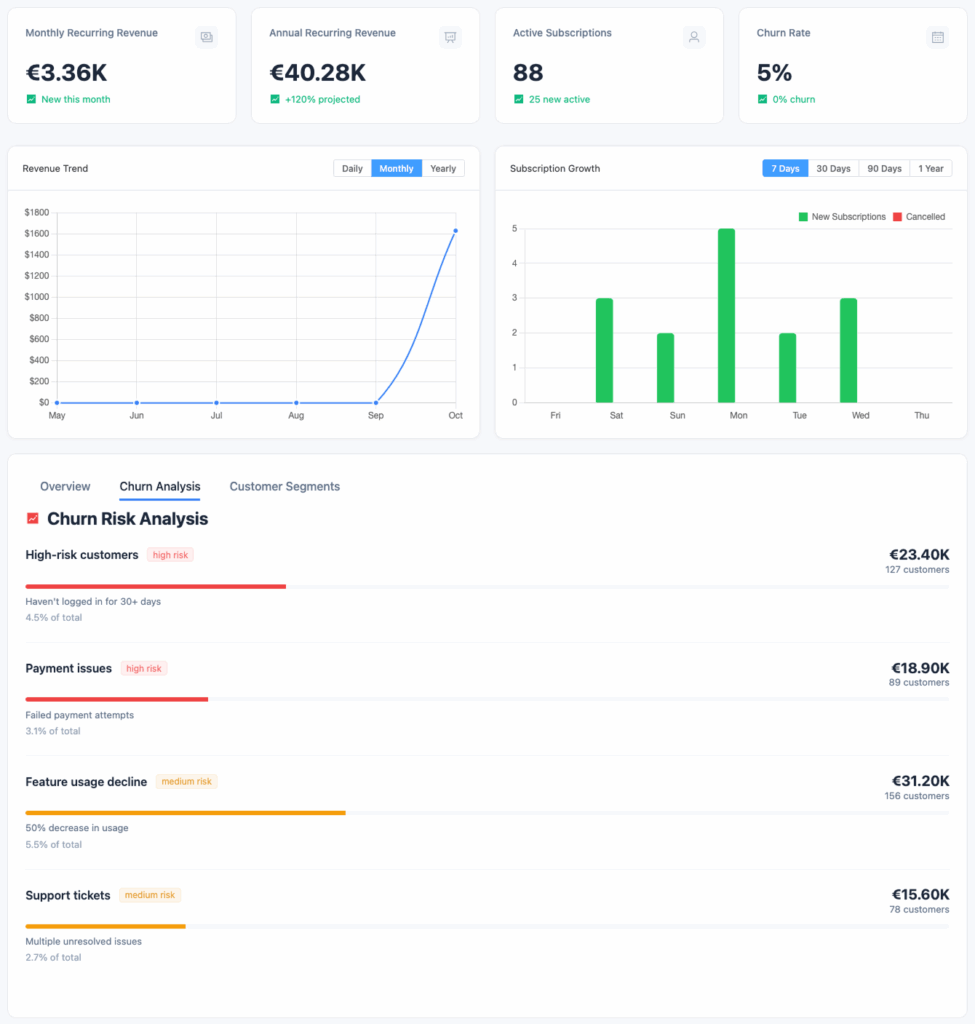
Visualizes: Cancellations and churn trends
Details:
- Tracks the number of canceled subscriptions per period
- Highlights voluntary (user-initiated) vs. involuntary (payment failure) churn
Why It Matters:
Helps you take proactive steps like sending win-back campaigns or improving billing retry logic.
Customer Segmentation Chart
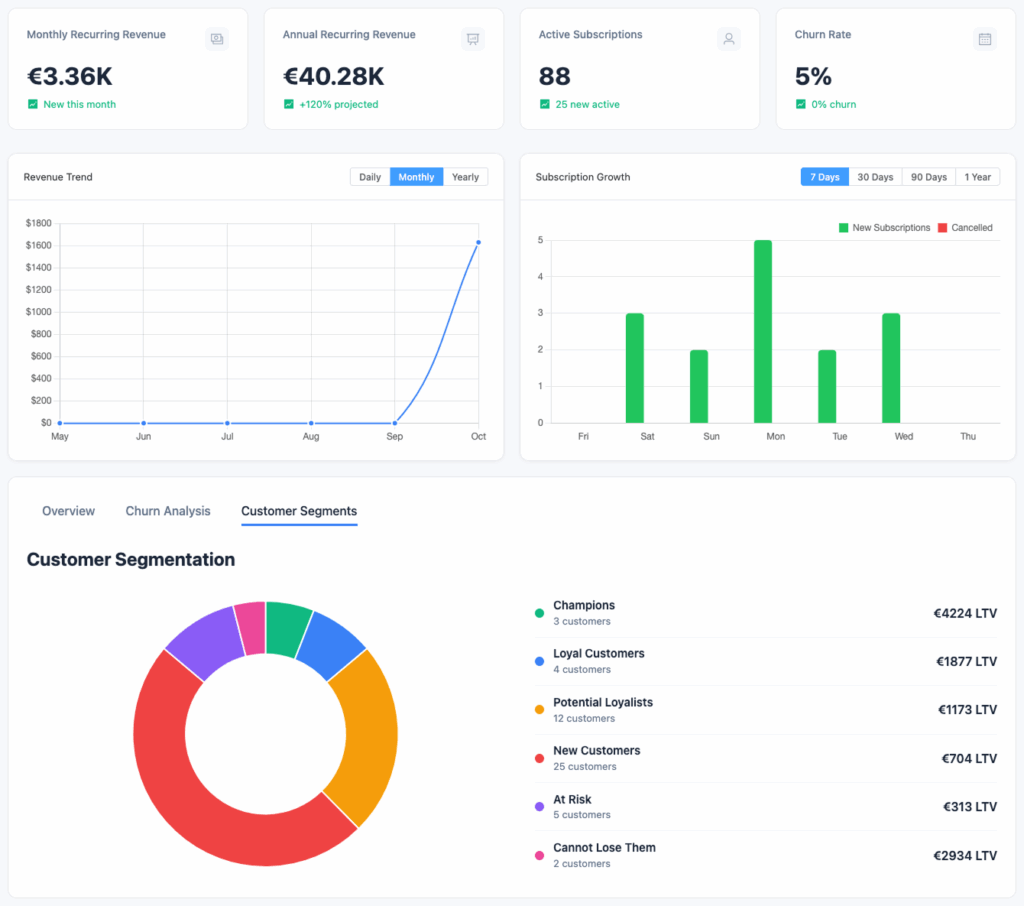
Visualizes: Distribution of customers by engagement level
| Segment | Definition |
|---|---|
| New Customers | Subscribed within the last 30 days |
| Active Customers | Currently active and paying |
| At-Risk Customers | Missed payments or inactive for long periods |
| Churned Customers | Canceled or expired subscriptions |
Insight:
Use this data to prioritize retention efforts and reward loyal customers.
Subscription & Customer Insights
Beneath the charts, Recurio displays dynamic summaries of your subscription base:
📋 Subscription Overview
- Count of Active, Paused, Canceled, and Expired subscriptions
- Average subscription length
- Top-performing products by active subscriber count
👥 Customer Overview
- Total registered customers
- New customers acquired this month
- Returning customer percentage
- Churned customer count
💵 Revenue Breakdown
- Revenue by Product
- Revenue by Payment Gateway
- Revenue by Billing Period
Use Case:
Quickly identify which products or payment methods generate the most consistent income.