The Analytics & Reports section in Recurio provides a complete overview of your subscription performance — helping you track revenue trends, customer retention, churn, and overall business growth.
It’s designed for store administrators who want actionable insights into their subscription-based revenue streams.
Accessing Analytics
Navigate to: Recurio → Dashboard
You can view quick metrics from the Dashboard, while the Reports section provides deeper analysis with export options and cohort tracking.
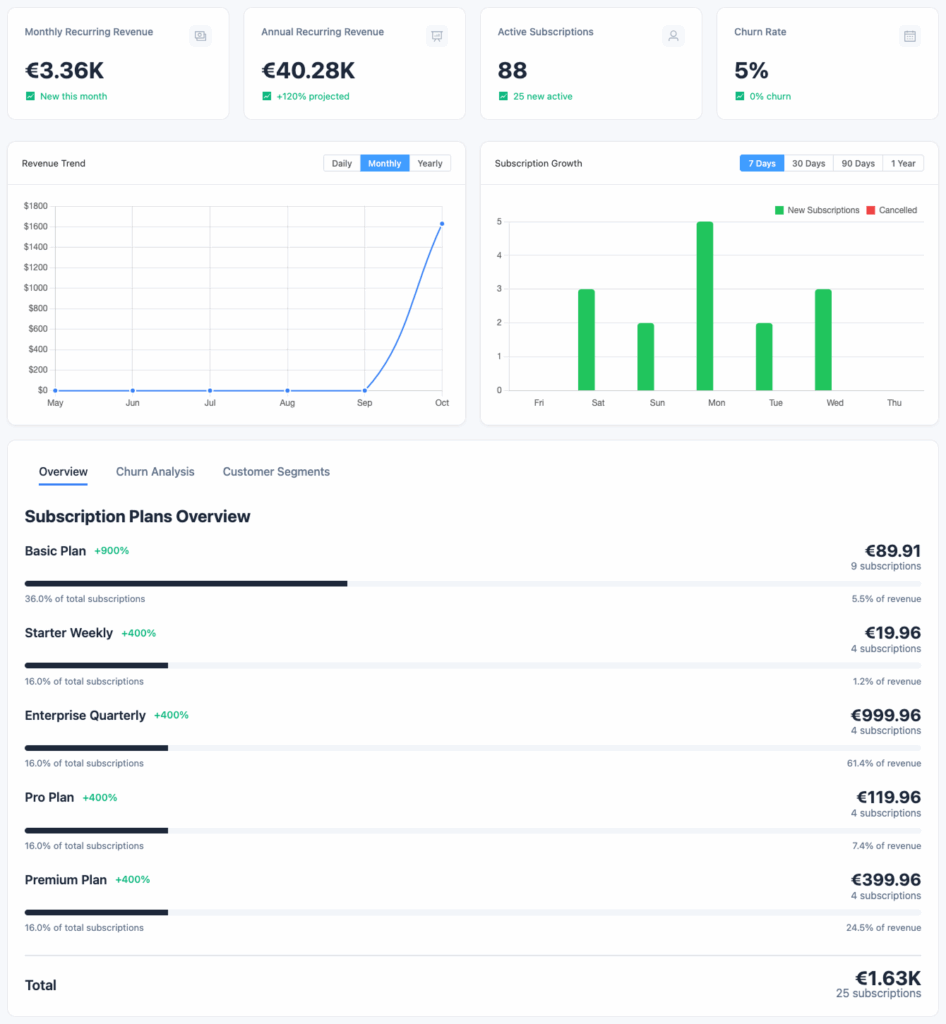
Dashboard Analytics Overview
The Dashboard gives you a visual summary of your most important subscription metrics updated in real-time.
Key Performance Indicators (KPIs)
| Metric | Description | Why It Matters |
|---|---|---|
| Monthly Recurring Revenue (MRR) | Normalized monthly recurring revenue | Measures predictable monthly income |
| Annual Recurring Revenue (ARR) | MRR × 12 | Estimates annual projection |
| Active Subscriptions | Total currently active subscriptions | Reflects ongoing revenue activity |
| Average Revenue Per User (ARPU) | MRR ÷ active customers | Evaluates pricing and user value |
| Customer Lifetime Value (LTV) | Average customer revenue over their lifetime | Helps plan acquisition costs |
| Churn Rate | % of customers who cancelled | Tracks customer retention and satisfaction |
| Growth Rate | Month-over-month active subscription growth | Indicates business momentum |
💡 Tip: Keep your churn below 5% and maintain consistent MRR growth to ensure long-term profitability.
Charts & Visual Reports
Recurio visualizes your subscription data to help you identify patterns and trends effortlessly.
1️ Revenue Trend Chart

Visualizes: Total MRR and ARR over time
Features:
- Line graph with hoverable tooltips
- Switch between monthly or daily views
- Real-time updates after every renewal
Use Case:
See how marketing campaigns or pricing changes affect revenue performance.
2 Subscription Growth Chart
Visualizes: New subscriptions vs cancellations
Features:
- Dual-bar visualization for “New” vs “Cancelled”
- Shows net growth trends
- Time filter (30 / 60 / 90 days)
Use Case:
Identify if churn or acquisition spikes align with product or pricing changes.
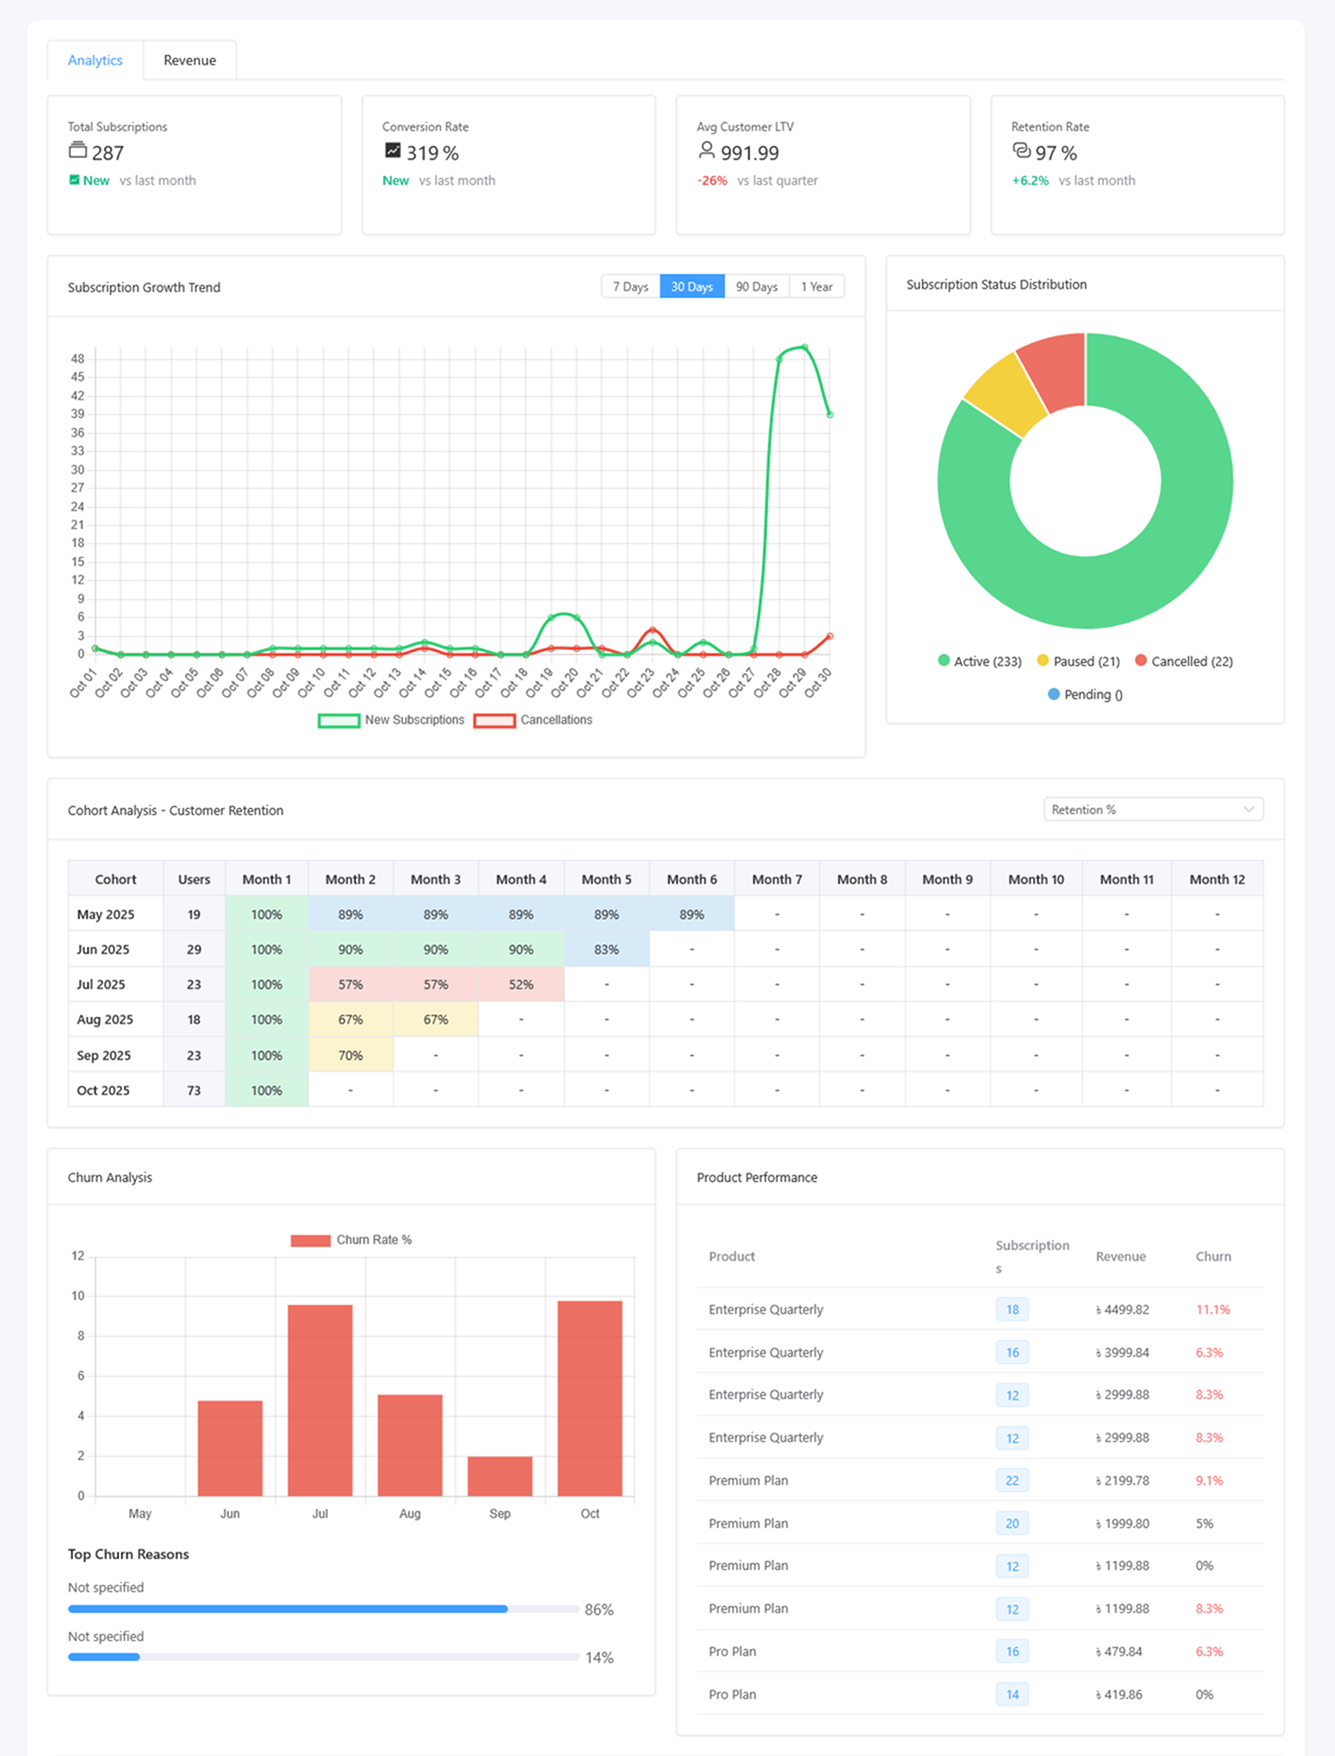
3 Churn Analysis Chart
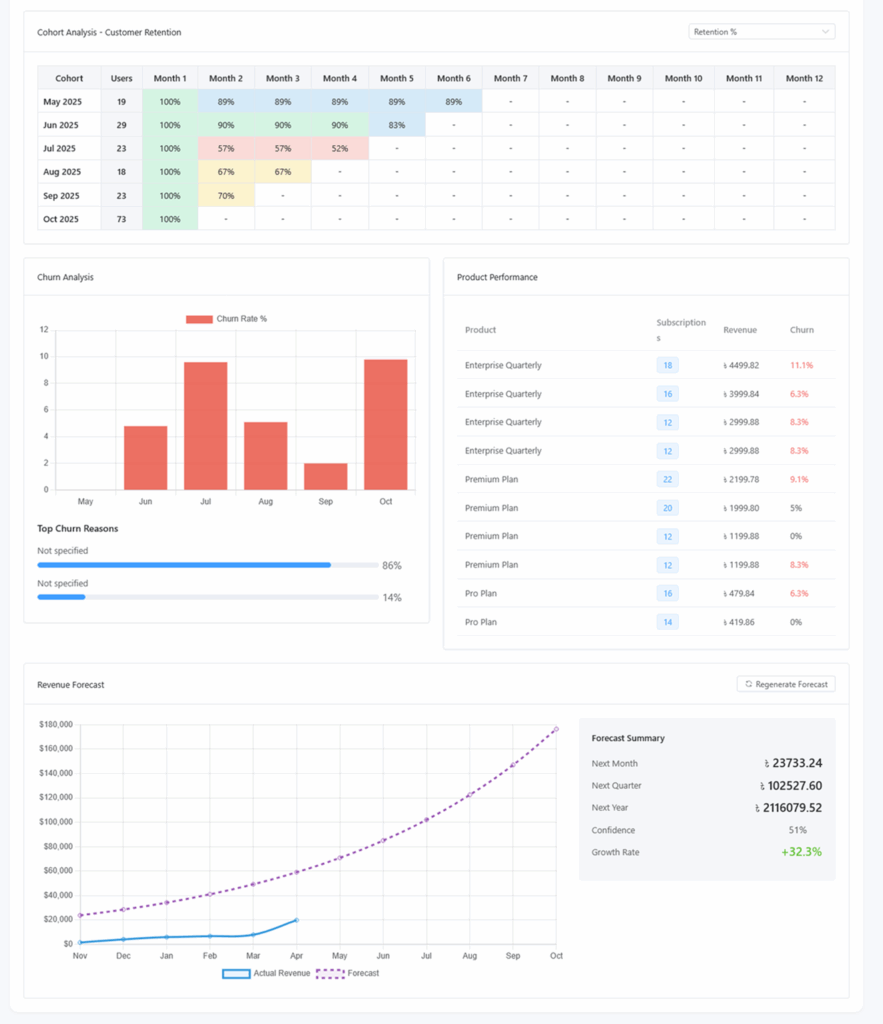
Visualizes: Cancellation patterns and churn percentage
Features:
- Tracks voluntary vs involuntary churn
- Displays trend line by month or week
- Helps locate retention pain points
Use Case:
Detect churn spikes and take proactive actions like dunning campaigns or retention emails.
4️ Customer Segment Distribution
Visualizes: Types of active customers
| Segment | Definition | Purpose |
|---|---|---|
| New Customers | Joined within last 30 days | Monitors acquisition success |
| Active Customers | Currently active subscribers | Indicates health of user base |
| At Risk | Failed payments or long inactive | Target for reactivation campaigns |
| Churned | Cancelled subscriptions | Track overall loss percentage |
Use Case:
Helps you design targeted retention or reactivation strategies.
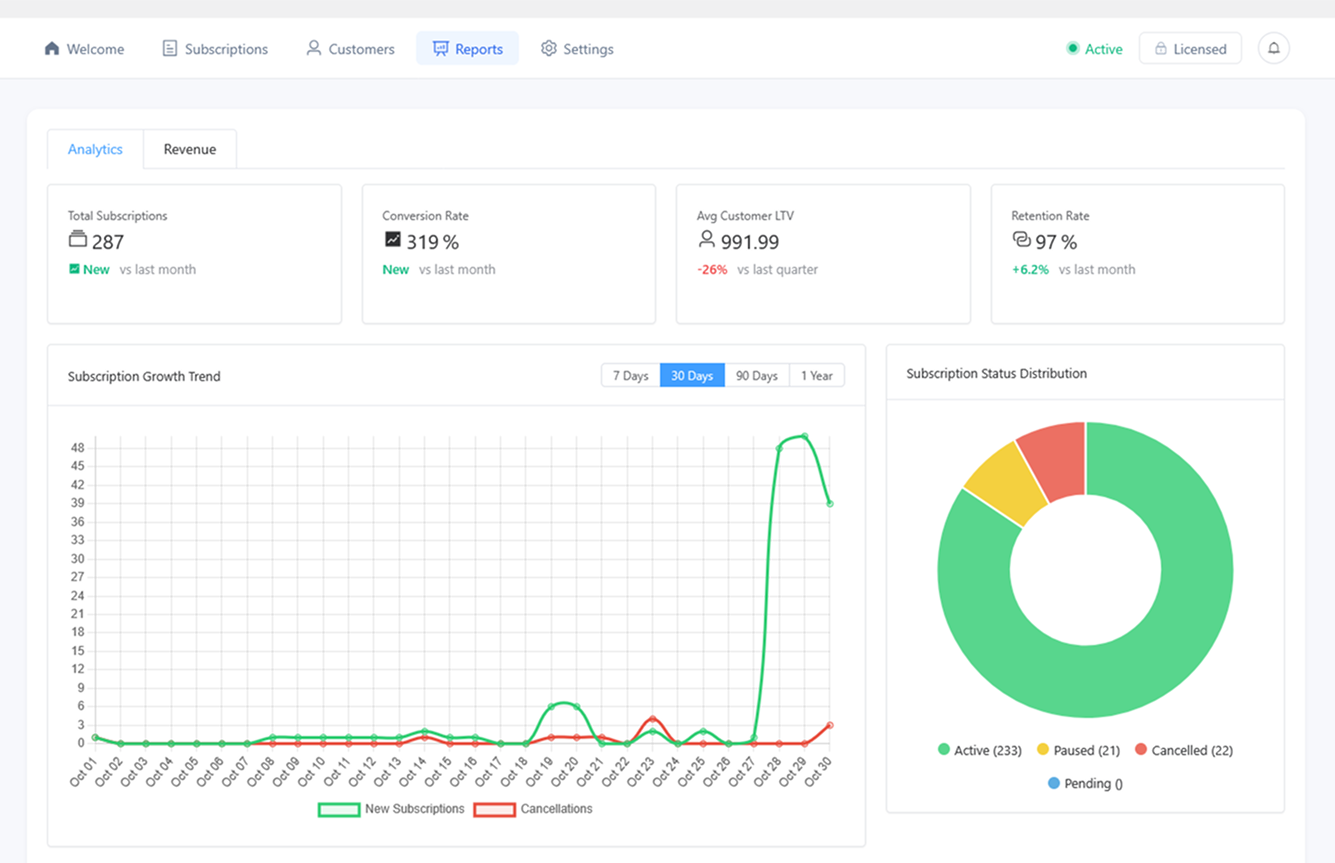
Reports Page Overview
Navigate to: Recurio → Reports
This page gives you advanced insights beyond the dashboard.
Tabs Available
- Analytics – Overall performance metrics
- Revenue – Payment and income breakdown
- Cohort Analysis – Retention tracking by signup month
1. Analytics Tab
Revenue Metrics
- Total Revenue (All-Time)
- Revenue This Month
- Revenue Growth Rate
- Revenue by Product
Subscription Metrics
- Total Subscriptions
- Active / New / Cancelled This Month
- Subscription Growth Rate
Customer Metrics
- Total Customers
- Active Customers
- Average Revenue Per User (ARPU)
- Customer Lifetime Value (LTV)
- Churn Rate
Export Data
Click Export to CSV to download all analytics data for further processing in Excel, Google Sheets, or BI tools.
2. Revenue Tab
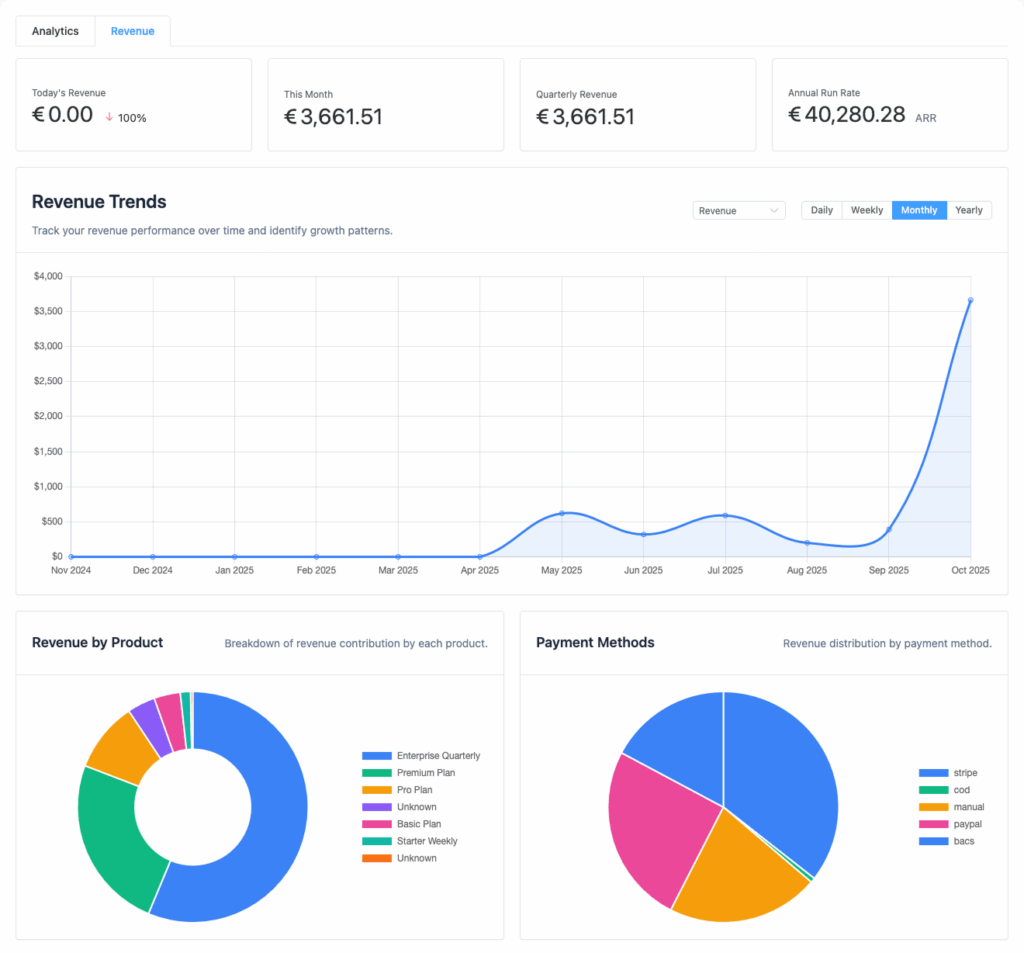
Overview
- Displays Total Revenue, Transaction Count, and Average Transaction Value.
- Select reporting period: Daily / Weekly / Monthly / Yearly.
Visual Reports
- Revenue Over Time: Line chart tracking income changes.
- Product Breakdown: Bar chart showing revenue by subscription product.
- Payment Method Distribution: Pie chart showing gateway usage (Stripe, PayPal, etc.).
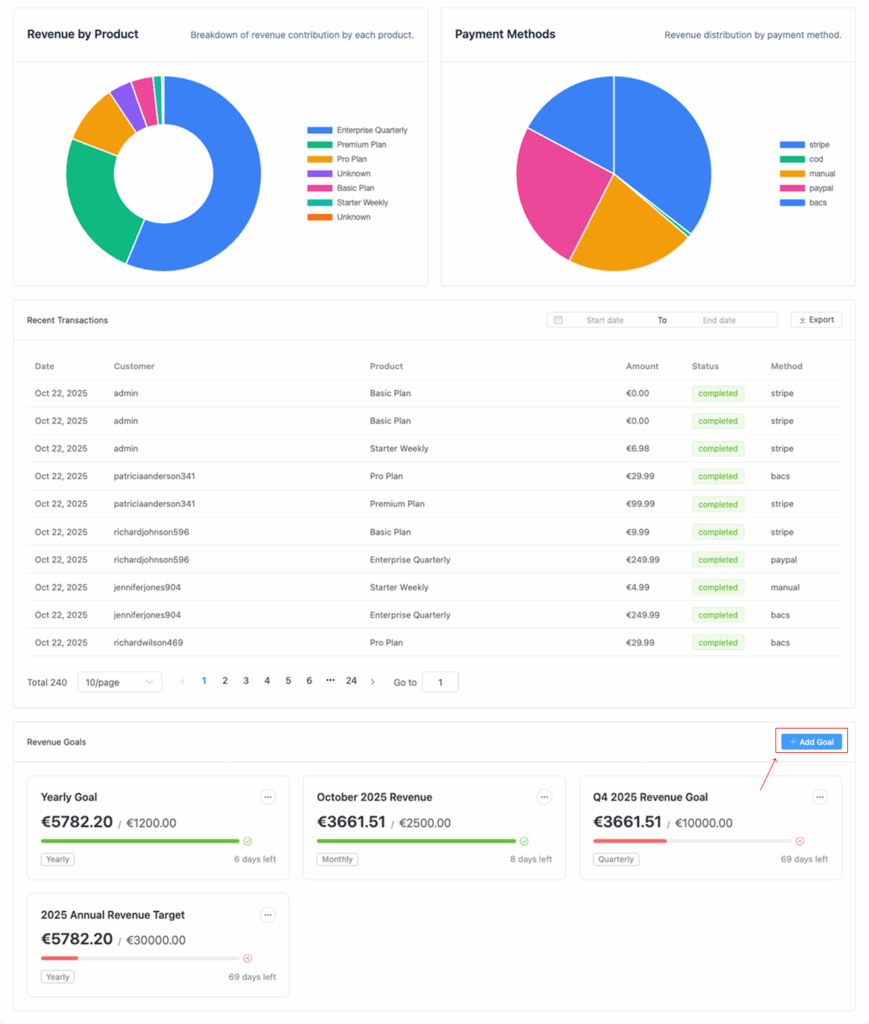
Transactions Table
| Column | Description |
|---|---|
| Date | Transaction date |
| Customer | Name and email |
| Product | Subscribed item |
| Amount | Payment charged |
| Gateway | Payment method used |
| Transaction ID | Reference from payment gateway |
| Status | Success / Failed |
Export Option: Download transactions to CSV for accounting or audits.
Revenue Goals (PRO Feature)
Create and track custom revenue goals.
Steps:
- Click Add Goal
- Enter Goal Name (e.g., “Q4 Target”)
- Set Target Amount and Period (Monthly, Quarterly, etc.)
- Save and track progress
Visual progress bars display goal completion percentage.
3. Cohort Analysis Tab
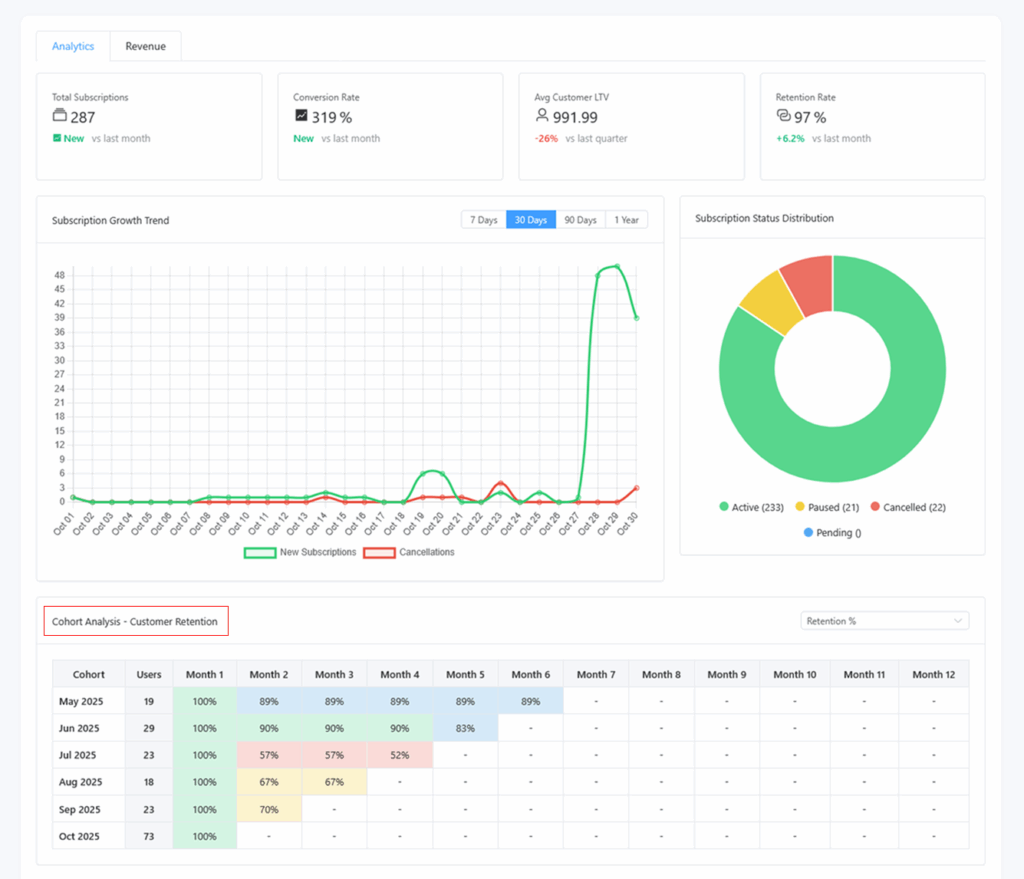
Purpose: Understand retention and revenue performance by customer signup month.
What It Shows
- Retention Rate: % of customers remaining active over time
- Revenue per Cohort: How much revenue each cohort contributes
- Subscriptions per Cohort: Active count per time period
How to Read the Table
| Row | Description |
|---|---|
| Cohort (Signup Month) | e.g., January 2025 |
| Columns (Months Since Signup) | 0 = Signup month, 1 = First month after, etc. |
| Values | Retention %, Revenue, or Active Subscriptions |
Heatmap View: Darker color = stronger retention or revenue.
Example Insight:
January cohort retains 90% after 3 months — indicates good customer experience and product fit.
Using Analytics to Make Decisions
| Metric | Decision Example |
|---|---|
| MRR Growth | Evaluate marketing campaigns |
| Churn Rate | Improve onboarding or dunning logic |
| ARPU | Test new pricing tiers |
| LTV | Plan ad spend or CAC budgets |
| At-Risk Customers | Trigger retention email flows |
Pro Tip: Combine Recurio’s analytics with WooCommerce order data for complete performance insight.
Troubleshooting Reports
| Issue | Possible Cause | Solution |
|---|---|---|
| Charts not loading | JavaScript conflict | Clear cache, disable conflicting admin plugins |
| Data missing | Cron job disabled | Enable WP-Cron or real cron setup |
| Wrong revenue amount | Manual payments not recorded | Verify transactions under Recurio → Subscriptions |
| Export not working | File permissions | Ensure /wp-content/uploads/ is writable |
| Cohort data blank | No historical subscription data yet | Wait for first full month of activity |
Quick Recap
By the end of this section, you can:
- Analyze MRR, ARR, churn, and retention trends
- View visual revenue and subscription reports
- Export business data for external analysis
- Understand cohort behavior and customer lifetime value